Stretching dark areas of a nebula

I'm impressed by the IOTD on Astrobin today by Yannick Akar. It's not about the details, the colors or the stars (that all great by the way) but the overall visibility and contrast in both dark and bright nebulosities in the image.

I guess it all starts from a correct stretching of the linear image but in my experience even trying any known stretching method (HT, MaskedStretch, GHS, Arcsinh, EZ softstretch) the darker areas remain too dark OR the brighter areas stand too bright.

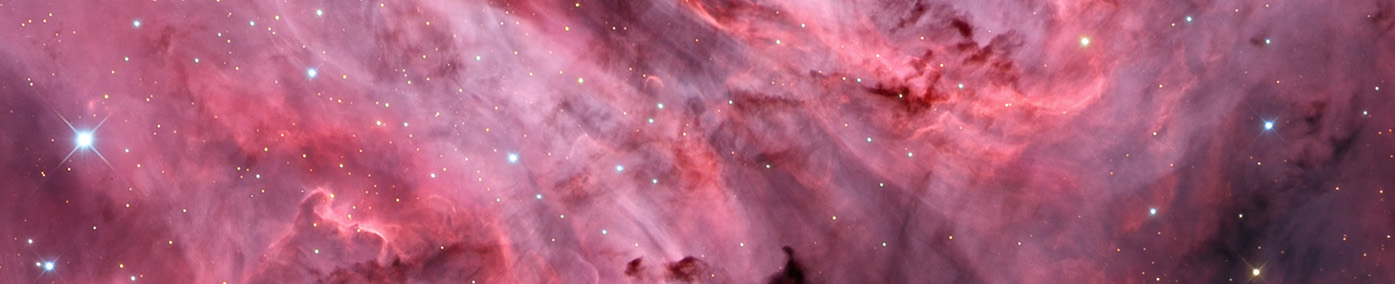
Attached an example of what I mean: my image (left) and Yannick's (right).

Is there any technique or video that addresses this topic?
It's managed in PI or Photoshop?

Ferrante

Comments

  • I think the first thing to do is ask Yannick what he is doing on his AB post. I suspect this is done in Photoshop (and other tools). Note that things in your image that are bright are nearly *dark* in his. So the answer is that he is suppressing the bright stuff and raising the brightness of the faint stuff aggressively. Exponential Transform, HDRMT, Masked Stretch... all have these flavors. (That last one is pretty close.) But there isn't a single step. Compressing the top end followed by aggressively brightening the bottom end..and adding additional contrast (like Local Histogram Transformation) will give this kind of look.

    -the Blockhead 
  • thanks Adam.
    As a starting point for these steps is adviced to have a generally dark stretched image and then raise selectively darker stuff or bring down the brightness locally on a brighter image?

    I will follow your advice anyway and ask him directly on AB.

    ferrante
  • Well..that depends. HDRMT works from the top down... whereas Masked Stretch from the bottom up.
    -the Blockhead
  • Hi Ferranti,
    I too admired the IOTD, certainly a fantastic image.
    I would answer your question by first making the distinction between pure stretching (a la HT, GHS, arcsinh, and I don't know about E-Z) is that they have 3 properties: 
    1) their transformations are true functions and not relations.  ie there is a one to one correspondence between linear (stretched values) and the non-linear (unstretched values).  This means the resultant pixel value is only dependent on the initial value, and that the transfrom is reversible.
    2) the rank order of pixel values throughout the image remains the same before and after the stretch (1st derivative of the transform is always positive)
    3) the transform and its slope (1st derivative) are smooth and continuous. (the 1st derivative part isn't technically necessary, but it avoids bunching up of pixels at inflection values) 

    In their "native state" the HT and arcsinh processes always add the most contrast at one extreme x(pixel value)=0 or the other (x=1).    The only way to avoid this is to clip.   However, the reformulation of these transformations within the GHS script, allows this point of maximum contrast to be placed anywhere in the image - ie freedom to put contrast wherever you want.   The claim to fame for the GHS equations, is that one can also control the concentration of stretch, or how focused the stretch is around the point that you maximum point that you choose.   All without violating 1, 2 & 3 and no clipping (loss) or data.   (The data loss of clipping is significant if one is trying to "work" the image with multiple stretches.)   The ability to choose the concentration and "focus" of contrast change/redistribution is how GHS can pull dim features, separate them as much as possible from background, yet not diminish contrast too much on the RHS to cause brightest star issues.

    If 1 and 2 or 3 are violated (masked stretch can violate this if the mask is stronger than the stretch, or the mask is not determined implicitly rather than explicity), and the "exponential stretch" can violate this (and indeed does so in one of Blockhead's demo plots) - and this can cause artifacts.   

    The curves process can also place contrast where you want, however, with both with spline or linear interpolation the one of the 3 conditions or clipping can occur if one is not careful, which is why it is only really useful at the end for fine adjustments.

    So with the GHS, HT, or arcsinh as formulated in the GHS script, one should be able to take advantage as much as possible of the true data.  Of these the GHS does the best job due to its ability to focus the contrast change.    Also applicable in the GHS script is the ability to control the overall image brightness that is achieved through two additional "degrees of freedom".   In any case, the GHS script presents a safe stretching environment (safe for the data, at least).

    I distinguish all the other processing / noise reduction / processes as 2nd order stretching based on a Laplace transform, Fourier transform, or whatever - because the resultant pixel values are not longer dependent on a original pixel value itself, but also on the value of neighbouring pixels.   Not that this is a bad thing, but it involves assumptions being made on why a pixel has a certain value.   In my opinion, the better the "true stretch" can come to your final result the better.   Additional processing can be used to enhance what you see - provided the assumptions are reasonable.

    I hope this helps.  I would try the GHS on your image to see what you get.   (I am not sure what was used in the IOTD).  It has more degrees of freedom and takes a while to "learn"  (it is not a one-button answer), but I think you will find the time investment worthwhile.

    Cheers,
    Dave
  • hi Dave,

    thanks for the very clear summary on stretching. I really appreciated the mathematical background that helps to better understand the effect of these functions in the stretching process.

    For this image I tried the GHS script, btw also following your video tutorials on youtube. 
    And GHS gave me the best results among all other processes / scripts.

    But still I'm able just to stretch the low end but get the high end too bright OR viceversa balance the bright end but dark areas get just black.

    Maybe I should try two GHS passes with a mask, I don't know. 
    For sure, as Adam suggested, asking Yannick is still an option to try.

    Thanks
    Ferrante
  • Hi Ferrante,

    I just posted a "recipe" for a least the initial stretch using GHS on astrobin and pixinsight forums - both of which are accessible via ghsastro.co.uk (or ghsastro.com).

    1) Once you have loading your linear image into the script, zoom in on the histogram and choose an SP to the left of the histogram peak, but within the area that is visibly, on a linear histogram basis, above the 0 line - precise placement isn't super critical at this stage.

    2) Set b to a high level 10-15 (I usually use 15 now), leave LP and HP at 0 and 1, and then zooming out of the histogram view) slide D to place the histogram peak at or above about 1/4 away across, watching the image preview to make sure you can see all of the background and subject matter comfortably.   For most images (unless the entire image is subject matter that you want to show), the contrast will likely be fairly low.   (This is because we likely picked this initial SP so low, that we put a lot of contrast to the left of the histogram).

    3) Pull up the Image Interrogator and show the preview mode.   What we want to do here is show the preview mode so we can see our way around, but what we are actually interested in the "before" value of pixels as shown in the upper left window.   What we are interest here is the before values for the dimmest parts of the subject matter (the dimmest parts of what you want to show against the background).  Click on a couple of spots in the image and mentally average the R,G,B values (if in colour) and average the before value of the various spots (or the minimum) .

    4) Exit the Image Interrogator and enter that estimate for  into the text box for SP.  (Now I know this involves typing a number, and Mike and I are looking at ways to avoid/streamline this).   This value of SP should be to the right (higher value) that you used to create the preview.   If this is not the case, use a lower SP for your image interrogation/enquiry.   For images, that for most of the area, contain just background you may end up with an SP value well to the right of the histogram peak.  For images that are entirely covered with subject matter, it will likely remain to the left of the histogram peak, but somewhat to the right of your initial SP pick.  

    5) Once you enter the number and hit <return>,  you will see the image and histogram change - likely the histogram peak will shift back to the left.   What we have done to the image is place that maximum contrast right where the subject matter emerges from the background.   If not, you may want to go back a couple of steps and adjust SP, but in most cases this is a pretty sure fire way to get a good value for the initial stretch SP.  Take a look at the histogram/image and unless you are very lucky you will have to make some adjustment to b and D, now that we have established SP.

    6A)  On the extremes you will have as SP well to the right of the linear image histogram peak (see 6B or 6C) if this is not the case.   In these cases you may have actually "bifurcated" or split into two the histogram and the image and thrown the histogram peak quite far to the left (the image will likely look awful).   The only tricky part here, is that you will find reducing either b or D, or both will start to shift the histogram peak of the resultant image back to the right and reduce the "bifurcation effect", caused by actually placing too much contrast here.    In most cases, you will want to remove any bifurcation of the histogram or the image preview by lowering D,b, and both - that way the image should smoothly transition from background to subject matter.  You can differentiate between D and b to place the histogram peak where you want it as well.   Since this likely represents background that you don't want to highlight in this case it will likely end up less than 1/5th the way across, but don't be overly concerned where the histogram peak is place.  A more important goal of this adjustment is described in 6C.

    6B)  In this extreme, it is likely that your SP chosen is still to the left of the linear histogram peak.   Your histogram may look fine, and your image may be ok, or even a little dark.   If you haven't used the maximum 15 for your b value, you may consider increasing this.   Otherwise you can increase or decrease D to see the dim features in the background that you are after.   In most cases, this will involve placing the histogram peak at or to the right of 1/5th the way across, but for now don't be overly concerned where precisely the histogram peak is placed - see 6C and 7. 

    6C)  In either case of 6A or 6B, I have found that my favourite view of images have a LOG histogram view (unzoomed) that, going right from the LHS of the log histogram view rises to a peak, then comes down and quickly transitions from its peak to a MONOTONIC (constant log slope) all the way to the RHS of the log histogram view.   This results the "best" distribution of contrast for many images., understanding that you may have a good reason to deter from this, but in most cases, something like this will be your ultimate goal.   Your adjustments of b and D should attempt to achieve this - ie trying to establish as best as you can, this monotonic log-histogram decline to the right of the histogram peak.

    7)  Once you feel you have done the best job you can, you may find you have lowered b even as low as 3 or 4 in this initial stretch.   You should always check the RHS to see if the brightest stars are starting to accumulate.   If so, you might want to add a dash of HP by lowering it from 1.   You may also find that this helps (or hurts) in achieving the "monotonic decine" log histogram shape you are after.   It can definitely also be used (decreases) to darken the image somewhat, but this is likely better reserves for a follow-up stretch.    The opposite, in terms of lightening the image can be achieved by increasing LP from 0, but you will not be allowed to increase it above SP which will still be at a very low value as it refers to the linear image.   Whether reducing HP or increasing LP - the goal is to ahieve, as best as you can a good distribution of contrast.    When you are there, the image should look pretty good as well, so don't forget to check the preview.   When satisfied, execute the initial stretch.

      Remaining stretches should involve takling any remaining bulges in the log histogram profile.   These bulges likely correspond to parts of the image that seem "flat" and need contrast to show detail.    By looking at the bulges and using the image interrogator to find these "flat spots" in the image, place SP where you want contrast added in the image, and bulges in the histogram profile pushed down.   In general use a higher b for sharp bulges, and a lower b for broad based ones, then D to achieve the result.    At the same time you can use HP, LP to control the image brightening - keepin an eye as to where the transform sits relative to the "identity" line, and  using HP to control both adjust "darkening"  and the stars on the far right of the of the histogram.   

    Give it whirl and let me know if it works for you.   I am particularly interested if you would actually need a "b" value greater than 15 to add the low end contrast to the image.   Also, you shouldn't have to engage BP adjustment on your linear image - but let me know if setting SP isn't enough.   It is only by testing the extremes that we learn how to limit the input parameters to the script.

    I hesitate on masks for stretching, because the use of them potentially violates the mathematic properties of GHS, but we allow for their use in the scripts.   Where masking can become an big issue is for those parts of the image where the mask is stronger than the stretch, GHS (or any stretching transform) can cease to be a true function (1:1 input/output relationship, with an always positive slope) and create artifacts.  An example of this is the ringing around stars in the masked stretch.    What I would rather try, if necessary, is a b > 15 in GHS if it is appropriate as all this would mean is an expansion of the valid input range in the script.

    Hope this helps.
    Dave
  • thanks Dave! unfortunately I will have access to my processing PC only next week but will give it a try asap and report the result here
    thanks again for your help.
    ferrante
  • edited April 2022
    hi Dave,

    in these days I tried several times to follow the steps above but the end result is either I cannot recover enough contrast on highlights if I initially stretch the lows or the lows are too dark if I keep contrast on the highlights.
    In other words, after step 3 I struggle to find a good next step.

    The quality of the data set is good, if you (or anyone else!) have time to take a look at it and give advice it's much appreciated.

    Thanks
    Ferrante

    Attached:
    - the initial histogram
    - the first stretch with its parameters. 
    - image sample
    - my best result on AB: https://www.astrobin.com/bqqphw/B/

    NGC_2238_profile.png
    501 x 351 - 45K
    NGC_2238_first_stretch.png
    1534 x 1025 - 771K
    NGC_2238_sample.png
    1001 x 932 - 707K
  • Hi Ferrante,
    Sorry I hadn't noticed this message.  
    In general the goal should be with the first stretch is to create a histogram (in log view) that from left to right, rises to a peak, may deline a bit and then finds a monotonic (constant) slope or gradient to the RHS.  This tends to distribute the contrast in a generally pleasing manner through the image, with the histogram peak (generally representing the background) at the level you want it.
    The second goal, should be to add contrast wherever there are bumps in the log histogram view, manifesting itself as "flatish" looking parts of image.  Be careful not to create valleys in the histogram by adding too much contrast at a single point.
    Finally, you may want to brighten or darken the overal image.  THis is best done with the assistance of the LP and HP sliders/inputs.  For example, put SP fairly close to 0 (say around 0.1) with a b of, say 3, and a modest D.   Then you can slide HP all the way down towards SP until you get your overall desired brightness.   The opposite can be done (SP close to 1 and move up LP) to darken.   Play with the parameters a bit and the lightbulb will go off.   Above HP and below LP, the stretch will be linear and you can even leave the linear part of any stretch at the 45degree, identity line to keep those pixels intact.

    So overall, I see a peak, at least in the red channel.  Try placing SP directly over this peak and flatten it out by adjusting D and B.  They move HP down and LP up to control what the stretch does to the other parts of the image away from this peak.

    I will take a look at the image myself, and try and show you what I did shortly...  I apologize again for not seeing your posting earlier.

    Cheers,
    Dave
  • Hi Again, Ferrante.

    So I spoke too soon, as I didn't realize that your image was a) starless and b) the nebulosity is everywhere in the frame.  
     
    My reference to the shape of the final "log view" of the histogram was a generalized shape for deep sky images that I read from the Sharpcap software documentation (I highly recommend this software for doing EIA, planetary, and other sorts of imaging - it is fantastic).   Although I have only tried a mittfull of imaging or processing software packages, Sharpcap was the only one I have seen to date that features a log-view of the histogram other than GHS, and this indeed was where i first saw this powerful concept.

    Anyways, back to your image.   For images where there are no stars you don't have to worry about star-bloat, of course, and you want to see contrast in pretty much all intensity/tonal values.  In this case Sharpcap documentation indicates that the histogram should appear as a block.  So with this in mind I used GHS to distribute contrast across the image more or less equally.   Now you can pick a different area to emphasize via contrast  and the sacrifice of another, but this was about the best I could do...just by stretching (with GHS).   Note the little gap left on the LHS of the histogram where pixels are really too dark to make out.  By making this gap wider, you can make the entire image brighter, but don't make it too wide or you are wasting contrast.  On the RHS I have pretty much butt the image up to the brightest side - hey there are no stars to protect and I wanted to use the full dynamic range of the display.

    Stretching only bases the new pixel brightness on the old pixel brightness and there is only so much contrast to distribute, when you add one place and take from another.   However you can trick the eye by using processes such as HDMRT (wavelet adjustments) or LHE that actually also bases the new pixel brightness on those pixels surrounding it!   This is essentially recycling contrast from non-neighbouring areas of the image and making it appear if there is even more dynamic range than there really is.  So, if it were my data, that would be my next process port-of-call.

    Your data is fantastic, by the way.  So well done!  I like it - even before going to HDRMT etc.

    Getting the knack of using the five key input parameters to GHS takes a little time playing and often multiple stretches and sometimes very many if you are very particular.   The good thing is other than a minor loss of fidelity at the edges of the histogram, your data (particularly 32 or 64bit) will not lose any integrity even after 10s (I have never gone to 100, but it would be a good IKEA-like test) of stretches.

    I hope this has been helpful, and check out the Sharpcap documentation on log histograms if you have it.

    Cheers,
    Dave

     
    NGC_2238.png
    694 x 456 - 865K
    histogram.png
    725 x 284 - 30K
  • hi Dave,

    thanks again for your help and for appreciating the data, the location and equipment really helps in this sense.

    My setup is based on a Linux box and unfortunately SharpCap is available on Windows only. But I can read the documentation on histograms for sure. 

    I will keep playing with the GHS parameters but now thanks to your explanation the behavior is much more clear to me.

    Thanks
    Ferrante


Sign In or Register to comment.